微信小程序中如何使用AntV F2图表,使用为了方便使用,我们封装了微信小程序的自定义组件,故需要微信小程序支持使用 npm 安装第三包。
使用方法:
安装 F2 依赖
# 安装 F2 依赖
npm i @antv/f2 --save

# 安装小程序组件
npm i @antv/f2-my --save

# 微信小程序--微信小程序这此安装,以上两个不用装
npm i @antv/f2-wx --save
添加 jsx 编译
package.js
{
  "scripts": {
    "beforeCompile": "babel pages --out-dir pages --only **/*.jsx"
  }}
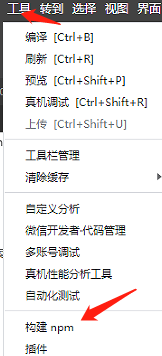
在微信开发者工具安装包

点工具构建包后,就可以在代码里使用了。

在要使用的小程序页面.json里引用
 {
   "usingComponents": {
     "f2": "@antv/wx-f2"
   }
 }
xml页面
 <view class="container">
   <f2 class="f2-chart" onInit="{{onInitChart}}" />
 </view>
index.wxss(十分重要,container和f2-chart一定要给宽高)
 .f2-chart,.container {
   width: 100%;
   height: 500rpx;
 }
.js
 Page({
   data: {
     onInitChart(F2, config) {
       const chart = new F2.Chart(config);
       const data = [
         { value: 63.4, city: 'New York', date: '2011-10-01' },
         { value: 62.7, city: 'Alaska', date: '2011-10-01' },
         { value: 72.2, city: 'Austin', date: '2011-10-01' },
         { value: 58, city: 'New York', date: '2011-10-02' },
         { value: 59.9, city: 'Alaska', date: '2011-10-02' },
         { value: 67.7, city: 'Austin', date: '2011-10-02' },
         { value: 53.3, city: 'New York', date: '2011-10-03' },
         { value: 59.1, city: 'Alaska', date: '2011-10-03' },
         { value: 69.4, city: 'Austin', date: '2011-10-03' },
       ];
       chart.source(data, {
         date: {
           range: [0, 1],
           type: 'timeCat',
           mask: 'MM-DD'
         },
         value: {
           max: 300,
           tickCount: 4
         }
       });
       chart.area().position('date*value').color('city').adjust('stack');
       chart.line().position('date*value').color('city').adjust('stack');
       chart.render();
       // 注意:需要把chart return 出来
       return chart;
     }
   },
 });


